Managing memory effectively is one of the most important aspects of Linux system administration. Whether you are a DevOps engineer, sysadmin, or simply a Linux enthusiast, knowing how to monitor memory usage can help you keep your servers stable and responsive.
One of the most commonly used tools for this purpose is the free command. In this article, we’ll take a detailed look at how to use free, understand its output, and explore practical real-world examples that will help you manage memory efficiently.
What is the free Command in Linux?
The free command is a built-in utility used to display information about the system’s memory usage. It shows:
Total memory (RAM) installed
Used memory
Free memory
Shared memory
Buffer/Cache usage
Available memory
Swap memory usage
In simple terms, the free command helps you answer:
👉 How much memory is my system using right now?
👉 Do I have enough free memory to run more applications?
👉 Is my system relying heavily on swap memory?
Basic Usage of the free Command
When run without any options, free displays memory usage in bytes.
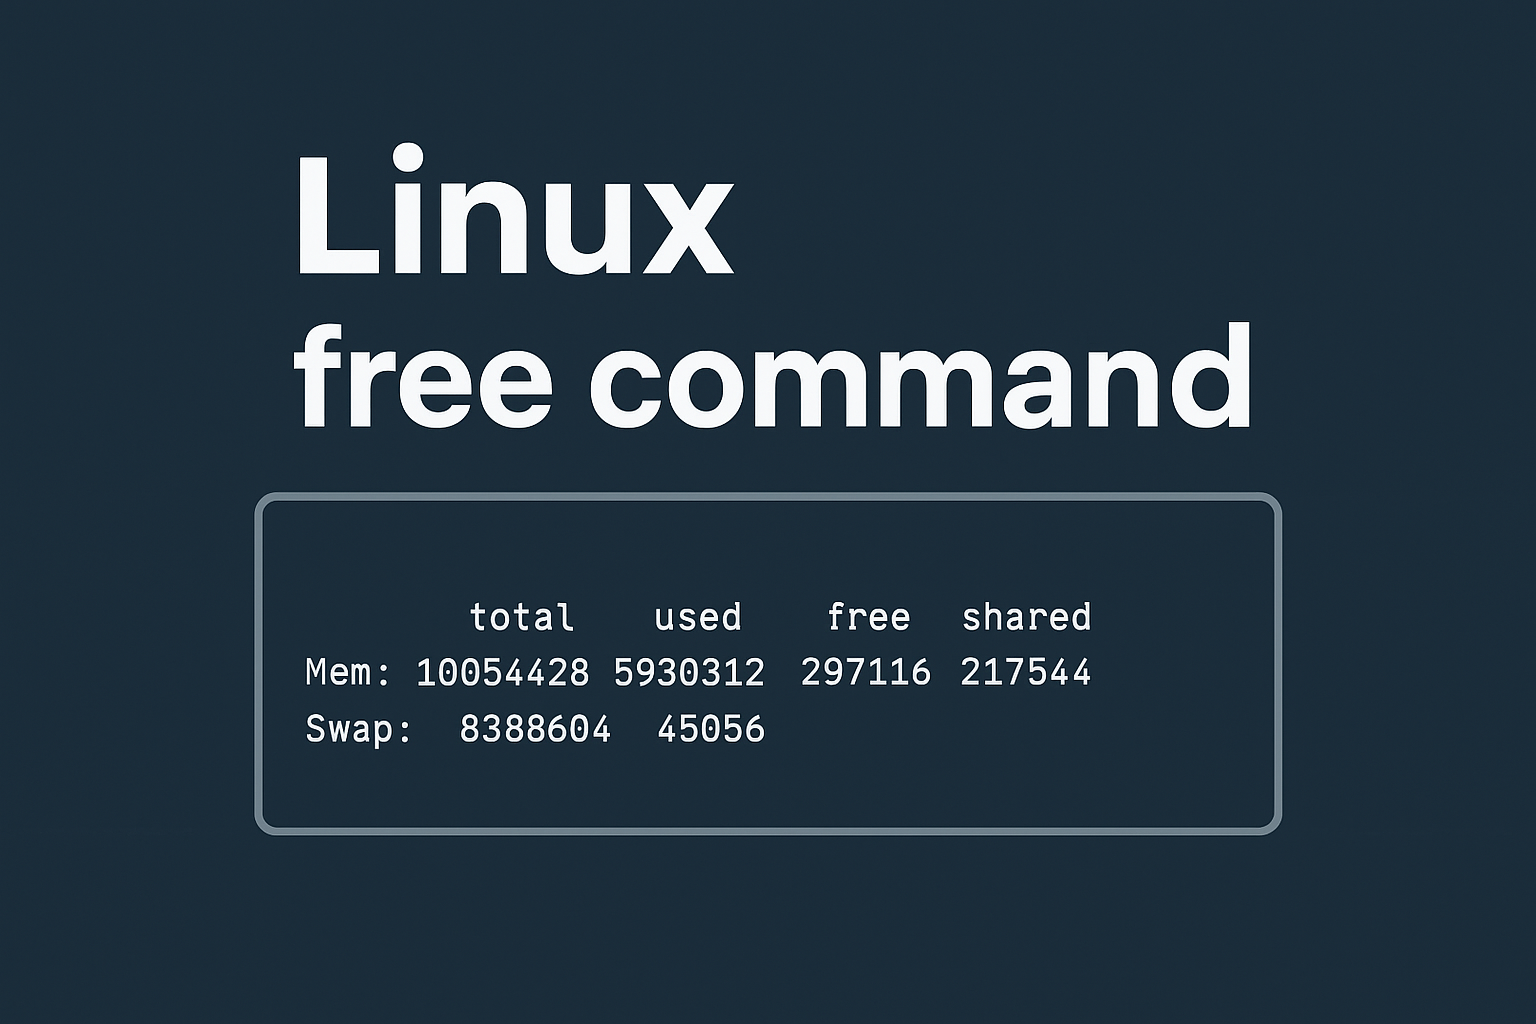
					~]# free
              total        used        free      shared  buff/cache   available
Mem:       10054428     5930312      297116      217544     3827000     3592572
Swap:       8388604       45056     8343548
Here’s what each column means:
total → total memory available
used → memory currently in use
free → memory not being used at all
shared → memory shared between processes
buff/cache → memory used by Linux kernel buffers and cache
available → memory available for new applications
💡 Real-life example: If your application is running slowly, checking the used and available columns can help you see if memory is the bottleneck.
Human-Readable Memory Output
Since the default output is in bytes, it’s not easy to read. You can use the -h or --human option to display memory in KB, MB, GB, or even TB.
					~]# free --human
              total        used        free      shared  buff/cache   available
Mem:           9.6G        5.7G        289M        212M        3.7G        3.4G
Swap:          8.0G         44M        8.0G
Now it’s much easier to understand: the system has 9.6 GB total RAM, with 5.7 GB used, and 3.4 GB available for new applications.
Displaying Total Memory (RAM + Swap)
Sometimes you want to see the combined memory usage including swap space. For this, use:
					~]$ free --human --total
              total        used        free      shared  buff/cache   available
Mem:            15G        5.7G        3.3G        107M        6.5G        9.4G
Swap:          8.0G          0B        8.0G
Total:          23G        5.7G         11G
This helps when you’re managing applications that rely on swap memory as a fallback.
Controlling Output Units
The free command allows you to control the output format with different unit options:
-bor--bytes→ show memory in bytes-kor--kilo→ show memory in kilobytes-mor--mega→ show memory in megabytes-gor--giga→ show memory in gigabytes--tera,--peta→ show in TB or PB
Example:
					~]$ free --giga
              total        used        free      shared  buff/cache   available
Mem:              9           5           0           0           3           3
Swap:             7           0           7
This is particularly useful when scripting or when you want consistent units in reports.
Monitoring Memory in Real Time
If you need to monitor memory continuously, use the -s or --seconds option. This refreshes the output every few seconds.
free --seconds 1 --count 10
--seconds 1→ refresh every second--count 10→ stop after 10 updates
💡 Practical example: While testing a memory-heavy application (like a database query or video rendering), you can watch in real time how RAM usage changes.
Investigating Swap Memory Usage
If your system slows down even though RAM looks fine, it might be using too much swap memory.
You can check swap usage with:
If swap usage is high, you can investigate which processes are consuming it.
Example command to list top 10 processes using swap:
					for file in /proc/*/status ; do
    egrep 'VmSwap|Name' $file | sed ':label; N; $! b label; s|\n| |g' | \
    awk '{print $4 " " $5 " " $2}';
done | sort --numeric --reverse | head
Sample output:
					296272 kB wdavdaemon
101292 kB wdavdaemon
82872 kB httpd
81860 kB httpd
81720 kB httpd
Here, processes like httpd and wdavdaemon are consuming swap.
Checking Normal Memory Usage per Process
Instead of swap memory, you can also check normal memory usage using VmData:
					for file in /proc/*/status ; do
    egrep 'VmData|Name' $file | sed ':label; N; $! b label; s|\n| |g' | \
    awk '{print $4 " " $5 " " $2}';
done | sort --numeric --reverse | head
This will show which processes consume the most regular RAM.
Filtering Specific Processes
Sometimes you only care about a particular service, like Apache (httpd). You can use grep to filter results:
					for file in $( ls /proc/*/status ); do
    egrep '^(VmSwap|Name|Pid)' $file | sed ':label; N; $! b label; s|\n| |g' | \
    awk '{print $6 " " $7 " " $2 " (PID " $4 ")"}';
done | sort --numeric --reverse | grep httpd
Example output:
					83968 kB httpd (PID 32287)
83080 kB httpd (PID 31545)
82476 kB httpd (PID 31621)
This makes troubleshooting memory issues with a specific service much easier.
Real-World Use Cases of the free Command
Before starting a large process – Check if enough free/available memory exists to avoid system crashes.
Debugging slow servers – Determine if RAM exhaustion is forcing Linux to use swap.
Performance tuning – Identify memory-heavy processes and optimize or restart them.
Capacity planning – Monitor memory usage trends over time to decide when to upgrade hardware.
Conclusion
The Linux free command is a simple yet powerful tool for monitoring system memory usage. From basic checks to advanced process-level investigations, it gives you valuable insights into how your system uses RAM and swap space.


